Quant Market Brief — September 2, 2026
Research cutoff: September 2, 2026, 6:28 a.m. CT (11:28 UTC). Premarket readings are indicative and may be delayed or non-consolidated.
1. Anthropic splits its new frontier model between broad and restricted access
Credit: original Market State Lab AI graphic.
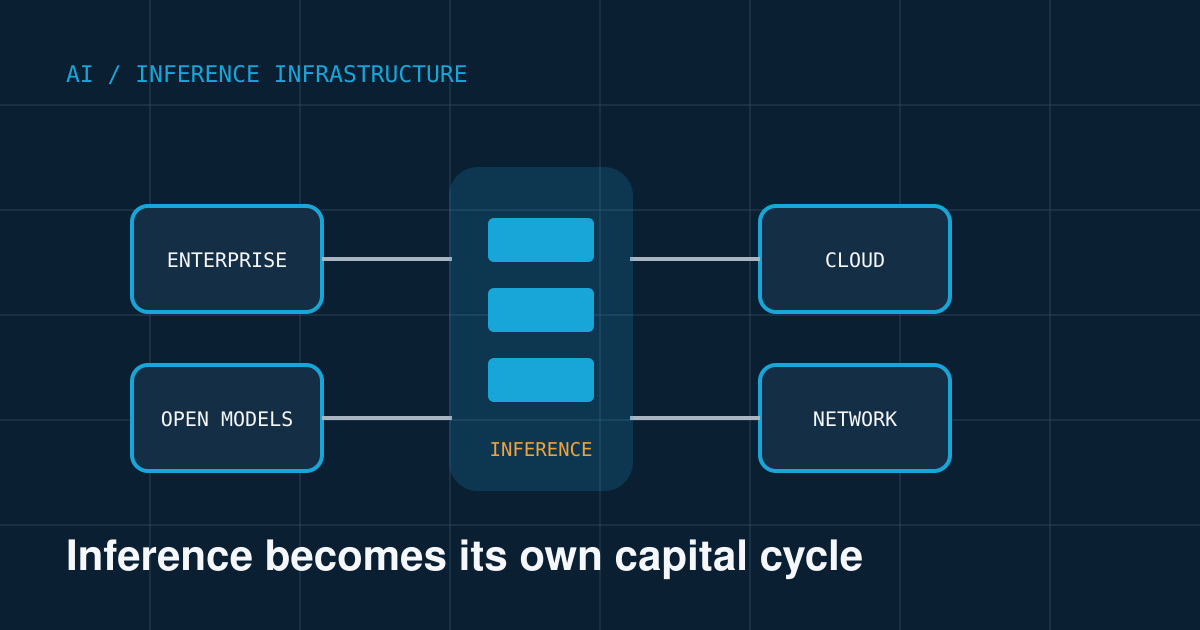
Fact: Anthropic released Claude Fable 5.1 for general use and Claude Mythos 5.1 for restricted, trusted access in cybersecurity and life sciences. Both use the same underlying model. Anthropic reports lower typical workload cost than Fable 5, stronger terminal and scientific-task results, and fewer cybersecurity false positives. Anthropic, September 1
Inference: Separating broad deployment from controlled high-capability access may become a common governance pattern for agentic models.
Uncertainty: The benchmarks and safety improvements are company-reported. Independent evidence on production reliability, latency, total cost, and adversarial performance is limited.
Why it matters: Benchmark MATLAB agents on end-to-end task success, latency, cost, tool-use accuracy, and regression stability. Keep provider adapters modular and place permissions and risk controls outside the model.
2. CME plans futures on six U.S. equity factors
Credit: original Market State Lab quantitative-finance graphic.
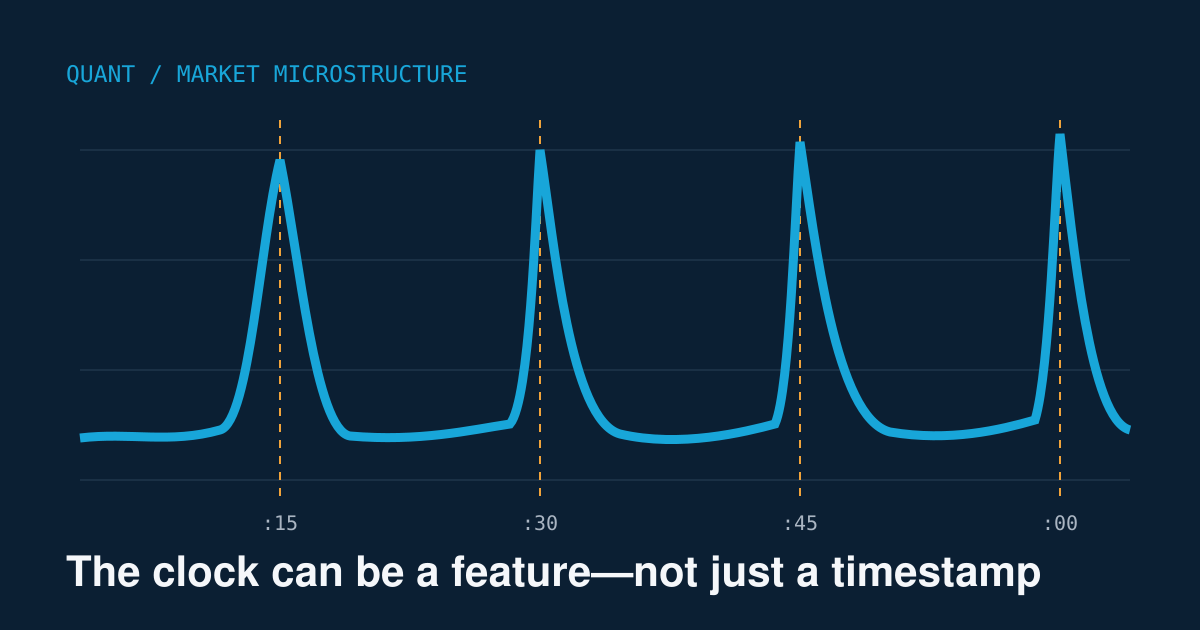
Fact: CME plans to launch E-mini futures on S&P 500 Growth, Value, Quality, Momentum, and Low Volatility indices, plus the Dow Jones U.S. Dividend 100 Index, on September 21, pending regulatory review. The contracts are expected to support Globex, block, derived-block, and BTIC trading and margin offsets with other CME-cleared equity products. CME Group, August 27
Inference: Direct factor futures could make tactical overlays and relative-value hedges more capital- and operationally efficient than trading baskets or ETF pairs.
Uncertainty: Approval, executable spreads, depth, volume, basis behavior, and market-maker participation are not yet established.
Why it matters: Build contract-specific basis, roll, liquidity, and transaction-cost models. Do not infer futures liquidity or tracking quality from the corresponding ETF proxies.
3. Nasdaq futures lag as oil and yields pressure duration-sensitive stocks
Credit: original Market State Lab U.S. markets graphic.
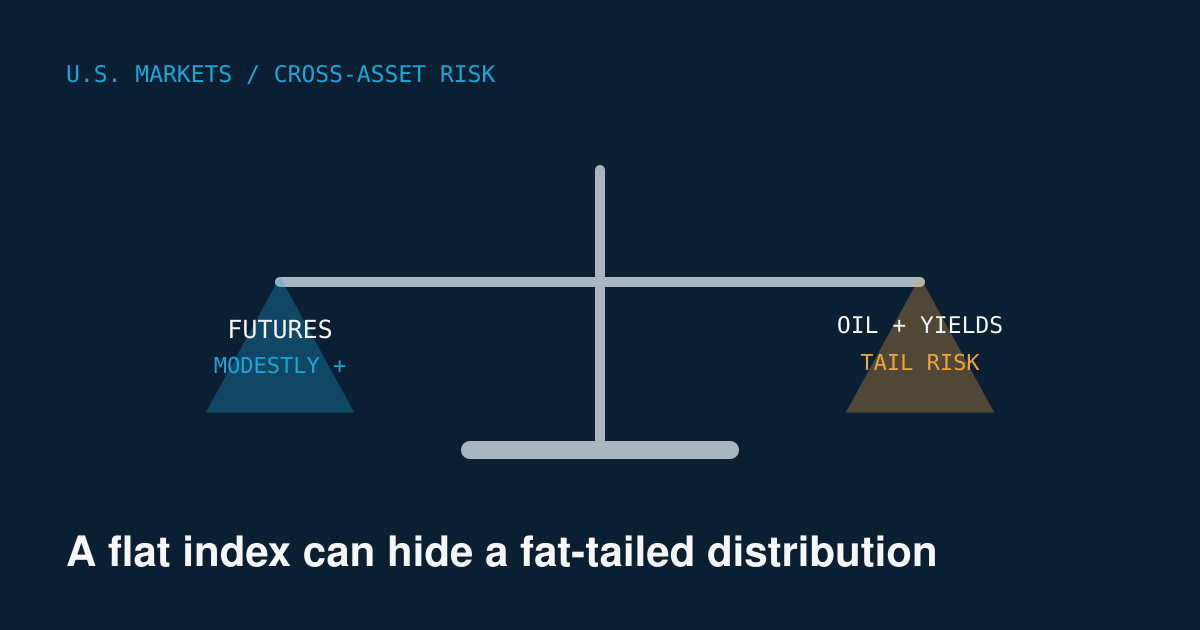
Fact: At 5:57 a.m. CT, Dow E-minis were down 0.15%, S&P 500 E-minis 0.25%, and Nasdaq-100 E-minis 0.52%. Rising oil prices and Treasury yields weighed on growth stocks; Dell and HPE gained after earnings while several mega-cap technology names fell. Reuters, September 2
Inference: Nasdaq underperformance is consistent with duration and semiconductor sensitivity, but it does not by itself establish a broad liquidity break.
Uncertainty: Futures were indicative. Consolidated spreads, depth, opening imbalances, and dealer gamma were unavailable.
Why it matters: Gate QQQ participation on NQ–ES relative strength, oil, yields, breadth, auction conditions, and realized slippage. Treat premarket, the opening auction, and the first 30 minutes as separate regimes.
4. U.S. federal debt crosses $40 trillion as financing costs rise
Credit: original Market State Lab economics graphic.
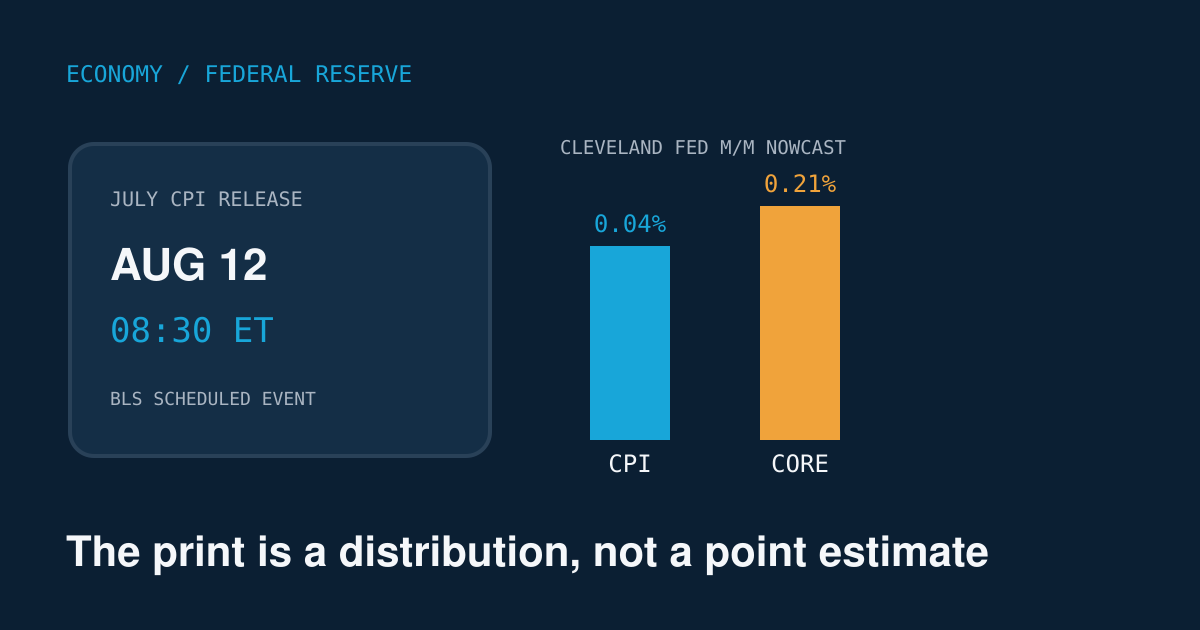
Fact: Reuters reported that gross U.S. federal debt exceeded $40 trillion. It cited a Congressional Budget Office estimate that tax and immigration legislation enacted in the current presidential term would add approximately $4.7 trillion to debt, while elevated yields increase financing costs. Reuters, September 2
Inference: Fiscal supply and term-premium risk can keep long yields elevated even when the expected policy-rate path is unchanged.
Uncertainty: Long-run debt projections and causal attribution are sensitive to growth, inflation, legislation, spending, and interest rates. The debt milestone does not imply an immediate Federal Reserve action.
Why it matters: Model the policy rate, Treasury supply, term premium, energy-driven inflation, and market-functioning interventions separately rather than collapsing them into one yield feature.
5. Dell raises its outlook as AI-server demand accelerates
Credit: original Market State Lab technology/business graphic.
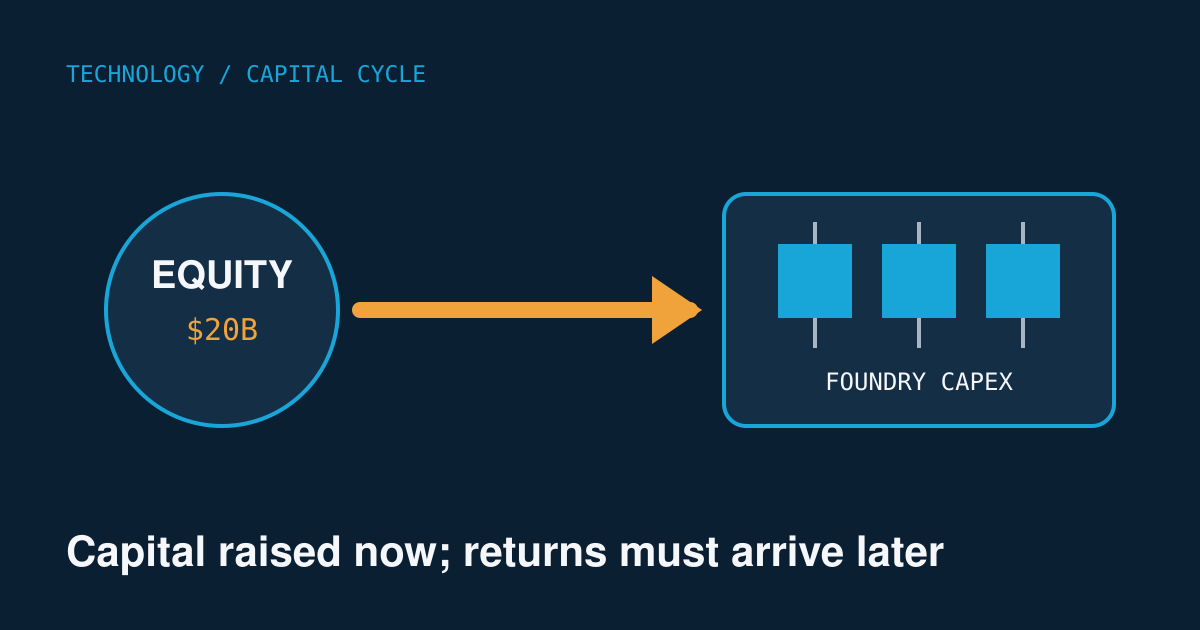
Fact: Dell raised its annual revenue forecast to $192 billion from $167 billion and its adjusted earnings-per-share target to $25.50 from $17.90. Second-quarter revenue rose 58% to $47 billion, above a $44.92 billion consensus estimate; Reuters reported record AI-server orders and backlog. Reuters, September 2
Inference: AI infrastructure demand remains strong, but the investment case is shifting from order announcements toward backlog conversion and incremental economics.
Uncertainty: Premarket gains were indicative. Backlog conversion, margins, customer concentration, component availability, working capital, and the duration of the spending cycle remain uncertain.
Why it matters: Track recognized revenue, storage and services attachment, gross margin, power and networking constraints, customer concentration, and free-cash-flow conversion—not orders alone.
Quant & Market Dashboard
Liquidity and funding
- Futures: At 5:57 a.m. CT, Dow, S&P 500, and Nasdaq-100 E-minis were down 0.15%, 0.25%, and 0.52%. Consolidated volume, spreads, and depth were unavailable.
- ETF proxies: SPY was indicated at 760.30, down 0.19%, at 6:11 a.m. CT; QQQ was 703.25, down 0.62%, at 6:07 a.m. CT. These were non-consolidated website quotes and may be delayed. SPY closed September 1 at 761.78 on 41.13 million shares; QQQ closed at 707.64 on 35.16 million shares. SPY, QQQ
- Treasuries: The September 1 indicative bid-side par curve showed 2-year 4.39%, 10-year 4.79%, 20-year 5.27%, and 30-year 5.27%, up 5, 4, 3, and 2 basis points from August 31. These are curve estimates, not transaction prices. U.S. Treasury
- Funding: The latest published observations at the cutoff were August 31 SOFR at 3.68% and EFFR at 3.63%. New York Fed SOFR, Federal Reserve H.15
- Volatility: VIX closed September 1 at 16.34. September, October, and November VX settled at 17.2528, 18.8535, and 19.3489—an upward curve. Cboe VIX, Cboe settlements
Volatility regime
Moderate, medium confidence. A 16.34 VIX close and VX contango do not signal acute stress, but Nasdaq underperformance, rising oil and yields, geopolitical risk, and Friday's employment report raise opening and event-gap risk. Normal-looking quoted spreads can coexist with poor depth and adverse selection.
Factor performance proxies
| Factor | ETF | September 1 | Four weeks* |
|---|---|---|---|
| Momentum | MTUM | −1.28% | −1.74% |
| Value | VLUE | −0.91% | +3.52% |
| Quality | QUAL | −0.73% | −0.34% |
| Size | IWM | −1.14% | −1.91% |
| Growth | IWF | −1.22% | +0.28% |
| Low volatility | SPLV | −0.20% | −2.19% |
September 1 versus August 3 closes. Split-adjusted ETF price proxies excluding dividends—not pure-factor total returns. Sources: MTUM, VLUE, QUAL, IWM, IWF, SPLV.
Low volatility led relatively on September 1, though every proxy declined. Over four weeks, value was the clear leader; momentum, size, quality, and low volatility were negative.
Execution implications
- Treat futures, ETF premarket, the opening auction, and the first 30 minutes as distinct liquidity regimes.
- Use auction-aware limits, participation caps, fresh depth checks, and realized-slippage kill switches.
- Rebuild SPY, QQQ, semiconductor, and Dell volatility, skew, open-interest, strike-liquidity, and gamma maps after the open.
- Weekly-expiry gamma can amplify moves near concentrated strikes; dealer positioning was not verified.
- Reject stale, crossed, zero-bid, one-sided, or thin options quotes.
- Synchronize oil, rates, factors, and equity signals using first-known timestamps and executable lags.
Watchlist: SPY, QQQ, IWM, TLT, VIX, MTUM, VLUE, QUAL, IWF, SPLV, DELL, HPE, SMCI, NVDA, XLE, USO, ES, NQ, CL, ZT, ZN, ZB, VX.
DRL Improvements for the MATLAB System
- Add NQ–ES strength, oil returns, two- and ten-year yield changes, VX slope, factor breadth and dispersion, event countdown, quote age, and auction state.
- Enforce drawdown, concentration, turnover, liquidity, and daily-loss constraints outside the reward; penalize downside risk, spread crossing, and implementation shortfall inside it.
- Randomize oil and yield shocks, factor-basis changes, auction gaps, spread widening, partial fills, stale quotes, latency, and nonlinear impact.
- Use purged, embargoed walk-forward evaluation with frozen baselines, multiple seeds, factor and liquidity regime scorecards, and untouched geopolitical and employment-event blocks.
Model hygiene
Control leakage, survivorship and look-ahead bias, first-known timestamps, corporate actions, stale options quotes, crossed markets, and multiple testing. Calibrate out of sample, retain rejected trials, and monitor feature, probability, policy, transaction-cost, and regime drift.
MATLAB optimization
- Align market, factor, event, and contract data with
timetable,retime, andsynchronize. - Vectorize rolling features, preallocate buffers, and profile environment steps and memory transfers before parallelizing.
- Run parallel
bayesoptonly across independent purged folds, using reproducible random streams and multiple policy seeds. - Reserve GPUs for sufficiently large neural-network batches; keep factor-basis, execution-cost, risk-constraint, environment, and agent modules separate.
High-value research question
Does the interaction of the overnight NQ–ES spread, oil return, ten-year-yield change, and prior-day factor dispersion predict QQQ opening continuation versus reversal after realistic auction and option-hedging costs?
This combines cross-asset stress with factor positioning while targeting a specific, repeatable execution decision.
Disclosure
Research and education only—not individualized financial advice. Market data may be delayed or indicative. Confirm live prices, liquidity, contract specifications, and risk before acting.